
Your quickest route to useful reports
Getting started with Consolidated XL
Follow a clear, step-by-step path from installing the Excel add-in to creating live financial reports from your connected accounting data.
- Free five-day trial
- Connect in minutes
- Guided training included
Recommended path
From installation to your first report
Complete these steps in order for the smoothest introduction to Consolidated XL.- 01 Install Consolidated XLAdd and open the Office 365 Excel add-in.
- 02 Connect your companyLink Xero or QuickBooks and synchronise your data.
- 03 Create a report with a wizardBuild balance sheets, P&L reports and dashboards quickly.
- 04 Learn the CXL functionsUnderstand granular and spill functions for flexible reporting.
- 05 Explore the function referenceLook up every function, parameter and reporting option.
How to Install
Within Office 365 Excel simply press Add-ins button on the Home toolbar in Office 365 Excel, and searching for "Consolidated XL"
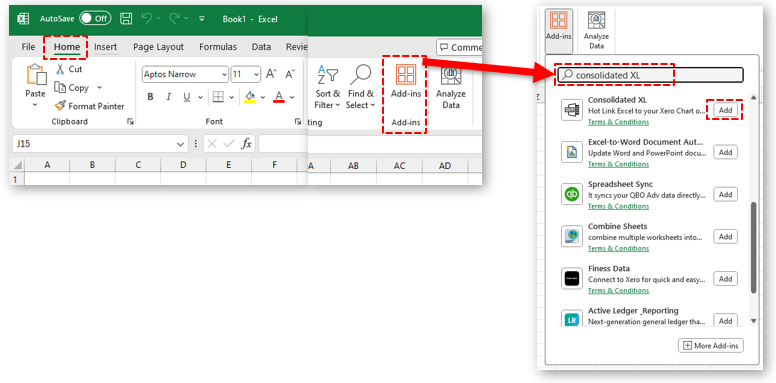
On Excel "Home" toolbar press [Add-ins] button
Search for "Consolidated XL".
Press [Add] to install in seconds
Example of CXL Functions
Granular Functions - One value returned
Pull General Ledger, Customer, Vendor,and Stock data directly into Excel — summarised, filtered, and always in sync, with drill down to transactions and trend graphs.
| For GL Account "200", in COMP_A, sales by period: GL examples | |
| Current year turnover: | =CXL.GLVal( "COMP_A", "200" ) |
| Year 2023 turnover: | =CXL.GLVal( "COMP_A", "200", 2023 ) |
| Year 2023 period 1 turnover: | =CXL.GLVal( "COMP_A", "200", 2023, 1 ) |
| Year 2023 turnover filter by Rep MARK: | =CXL.GLVal( "COMP_A", "200", 2023, 199, "MARK" ) |
| Year 2023 period 1 to 6 turnover: | =CXL.GLVal( "COMP_A", "200", 2023, 106 ) |
| For Total SALES and PROFIT, in COMP_B, sales by period: | |
| SALES Year 2023 period 1 turnover: | =CXL.GLVal( "COMP_B", "#SALES", 2023, 1 ) |
| GROSS PROFIT Year 2023 period 1 turnover: | =CXL.GLVal( "COMP_B", "#CalcGrossProfit", 2023, 1 ) |
| SALES 2023 period 1 to 6 turnover: | =CXL.GLVal( "COMP_B", "#SALES", 2023, 106 ) |
| PROFIT for Rep Mark in 2023: | =CXL.GLVal( "COMP_B", "#CalcNetProfit", 2023, 0, "MARK" ) |
| See Major Headings for these '#' codes. #OTHERINCOME,#COS,#OVERHEADS,#BANK, #ASSET, #LIABILITY, etc. | |
| For GL Account "200" , in COMP_A, sales between Dates: | |
| Feb 10 to March 20 turnover: | =CXL.GLValDate( "COMP_A", "200", 10 Feb 2023, 21 March 2023 ) |
| Get Balance in COMP_A: | |
| For all Banks: | =CXL.GLVal( "COMP_A", "#BANK" ) |
| Bank Account GL 21010: | =CXL.GLVal( "COMP_A", "21010") |
| All Liabilities: | =CXL.GLVal( "COMP_A", "#LIABILITY") |
| Get GL Account name, from COMP_A: GLName examples | |
| Get name: | =CXL.GLName( "COMP_A", "200" ) |
| Stock Item PROD1, in COMP_B: Stock examples | |
| Year 2023 period 1 sales turnover: | =CXL.ItemSalesVal( "COMP_B", "PROD1", 2023, 1 ) |
| Qty Sold period 1 to 6 turnover: | =CXL.ItemSalesQty( "COMP_B", "PROD1", 2023, 106 ) |
| Year 2023 profit margin: | =CXL.ItemProfitMargin ( "COMP_B", "PROD1", 2023) |
Spill Functions - One function returns a report
Pull Profit and Loss, Age Debtors/Credits, Stock Turnover, Customer/Vendor Transation report, etc.
| Get GL Account Code List from COMP_A: Code Spill examples | |
| Heading (P&L order), Code order: | =CXL.CodesSpill( "COMP_A", "GLCodesByHead" ) |
| 2 consolidated companies list: | =CXL.CodesSpill( "COMP_A,COMP_B", "GLCodesByHead" ) |
| by code order for selection list: | =CXL.CodesSpill( "COMP_A", "GLSelectCodes" ) |
| Spill Profit and Loss Report, from COMP_A, from one function: GL Spill examples | |
| Profit and Loss Report from one function: | =CXL.GLValSpill( "COMP_A", "#ReportPL^>" ) |
| By Rep MARK, show last 2 years and 6 periods: | =CXL.GLValSpill( "COMP_A", "#ReportPL^>", 2, 6, "Mark" ) |
| See Calculated Headings for these '#' codes. #ReportBAL,#CatCOS,#CatOVERHEADS,#CatSALES,#CatCurLiab etc. | |
| Spill Aged Debt Report, from COMP_A, from one function: Aged Receivable/Payable examples | |
| Age Summary by 10 days intervals, 8 columns: | =CXL.AgeDebtTotalSpill( "COMP_A", "Receivable", 10, 8 ) |
| All Outstanding Receivable Transactions: | =CXL.ContactTransSpill( "COMP_A", "Receivable" ) |
| Spill Top Stock Sales, from COMP_A, from one function: Stock Item Spill | |
| 2 years totals, last 6 months: | =CXL.ItemBySpill( "COMP_A", "Sales", 2, 6,"","",20 ) |
| For Rep MARK, in Calander Quarters: | =CXL.ItemBySpill( "COMP_A", "Sales", 2, 6,"MARK","",20,"CQ" ) |
All by Financial Period, Calendar Month, Week, or Date (GL only). Filter by Tracking 1/2 or QuickBooks Class or Location